コンピュータベースレーザー血流計 OMEGAFLO-Lab

Theory and Measurement example

Theory

The laser tissue (Doppler) blood flowmeter (LBF) measures tissue blood flow based on the fluctuation of the scattered laser light from tissue. This LBF is for tissue blood flow including microcirculations, but not for one blood vessel.
The laser light is scattered by static tissue and change the direction before colliding red blood cells (RBC), and the blood flow direction in microcirculation is not unit. Therefore, the information of the blood flow velocity is proportional to RMS.

When the laser light is irradiated on a tissue having a non-moving RBC (Fig. 1), the electric field, E, detected by the photo detector is the summation of the scattered lights from many points. The scattered light from the static tissue and a RBC are not shifted in frequency. Therefore, the relation between the each phase of the scattered lights is temporally and spatially constant, and the signal of the light intensity, I, from the photo detector is constant, too. The intensity, I, is expressed as I ∝┃E┃2.
The case a RBC is moving in a tissue is considered next.

Fig.1 Scattered light from non-moving particles and static material

Fig.1 Scattered light from non-moving particles and static material

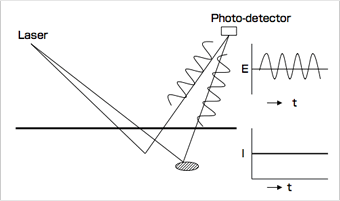
When the RBC moves from the time t1 to t2 in the velocity (Fig. 2), V, in the tissue, the scattered light is shifted in frequency. However, the scattered light from the static tissue is not shifted in frequency, and its phase does not temporally change on the photo detector. Then, there is the discrepancy of the two phases on the photo detector. Also, when the RBC moves continuously, this discrepancy temporally changes. Therefore, the electric field, E, fluctuates by the summation of the scattered lights from many points, and the light intensity of the photo detector fluctuates, too (Ki andKf : wave vectors) .
The speed and the magnitude of the fluctuation are related to the velocity and the number density of RBCs respectively.
The simple theoretical equations are described below.
The vector of the laser light irradiated on a moving RBC is represented asKf、and the wave vector of the scattered light is represented as Ki. Here, Ki= (2πλ)・u and u is the unit vector. The electric field of the scattered light is expressed as
E = Eoexp[-i(Kf – Ki)・vt].
Here, Eois the electric field of the light irradiated on the moving RBC, and v is the vector of the velocity.
This equation shows that the phase component being in proportion to the velocity of the RBC is added on the original laser light. Also, the frequency shift, Δω, can be expressed as
Δω = (Kf – Ki)・v.
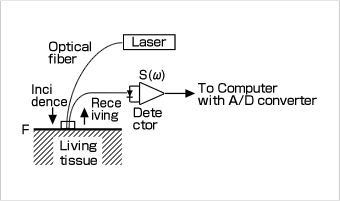
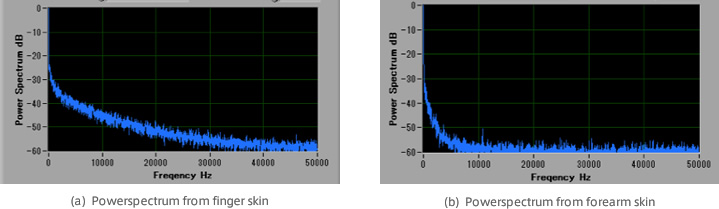
The laser tissue blood flowmeter using a fiber optic probe is treated as that the scattered lights from RBCs are Doppler shifted, but the instrument does not measure the Doppler shifted frequency itself. The detected light of the photo detector shows temporal fluctuation in the optical intensity, and tissue blood flow value is calculated from the intensity and the component of the fluctuation of the detected light as the normalized first moment of the power spectrum,
FLOW = ∫ωP(ω)dω(1)
Here, ω is angular frequency and P(ω) is the power spectrum of the detected light intensity.
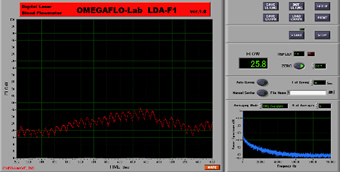
The laser diode having 780 nm wavelength is used for measurement because the difference of the absorption between Oxy-Hb and Deoxy-Hb is small. The optical fibers in a probe are graded index fibers and the core diameter is 100 µm. The distance between the incidence and receiving of the standard contact type probe is 0.5 mm, and the measurement depth is about 1 mm from the surface.

Fig.2 Scattered light from moving particles and static material

Fig.2 Scattered light from moving particles and static material

Figure 3 shows the block diagram of the electric cinvertercircuit of the OMEGAFLO, FLO-Lab. This is constructed from the laser unit, the photo detector (photo-diode) and the opt-electric converter amplifier. The power is supplied from the USB of a computer.

The raw signal, S(ω), after the opt-electric converter is input to the computer through the A/D converter, and the calculating blood flow is operated according to the eq. (1). The power spectrum is obtained by FFT, and the frequency characteristic is shown on the computer display. The time for data acquisition for FFT is expressed as ,
Tc= N / (2・Fd)(2)

Fig3. Block diagram of Computer-based laser blood flowmeter

Fig3. Block diagram of Computer-based laser blood flowmeter

Here, N is the number of the sampling point on the power spectrum, andFd is the detected frequency range. Whenthe detection frequency range is 120 KHz and the N is 12,000, TC is 0.05 sec.
The example display on the computer is shown in Fig. 4. The central graph is the time course of blood flow, FLOW, and the value is on the right side. The FFT graph is shown on the right bottom. The frequency range for the operation can be entered on the Setup display opened by the SETUP button.

Fig.4 Computer display of FFT laser blood flowmeter

Fig.4 Computer display of FFT laser blood flowmeter

Frequency spectrum of blood flow signal

Fig.5 shows the power spectra from a finger skin, fast blood flow, and a forearm skin, slow blood flow. The laser light is scattered by static tissue many times before collision with red blood cells and the flow vector of red blood cells are not unity, the power spectrum is breading.

The blood flow signal from the finger skin has a wider spectrum to about 100 KHz, but that from the forearm skin has a narrow spectrum to about 15 KHz. The conventional laser blood flowmeter does not have such a wide detection frequency range, and the blood flow of the finger skin is underestimated. Also, for the forearm skin, the white noise over 15 KHz will be the blood flow noise, and the signal to noise ratio becomes lower when the conventional laser blood flowmeter is used. Therefore, confirming the frequency characteristic of blood flow and setting the appropriate frequency range is very important.

Fig.5 Powerspectra of tissue blood flow

Fig.5 Powerspectra of tissue blood flow

Auto Zero Null Function

The electric circuit generates noise. Also, when the laser light is detected by a photo detector the shot noise is generated, too. OMEGAFLO-Lab has the function for eliminating the noise automatically. The first moment of the power spectrum generated by the noise is expressed as,
∫ωPnoise(ω)dω=(A+B×I)×fd(ω)(3)
here, A is the component ovf the basic noise, B is the coefficient of the shot noise, I is the detected laser light intensity, and fd(ω) is the function of operating frequency range. The value obtained from eq. (3) is subtracted from eq. (1), and the blood flow without offset value can be automatically obtained.

Measurement example

Fig. 6 shows the comparison of the blood flow of a finger skin between the conventional laser blood flowmeter, FLO-C1 between the FLO-Lab. The FLO-C1 measured the index finger, and the FLO-Lab measured the middle finger under the valsalvamaneuver for 30 sec. The time constant of the zfLO-C1 was 1 sec. The Setup of the FLO-Lab was the 25 KHz operating frequency range, and the 10 times of averaging of the FFT data (equivalent to 1 sec AVG). They showed the same blood flow changes.

Fig. 6 Example of finger skin blood flow

Fig. 6 Example of finger skin blood flow

Unit of tissue blood flow and the characteristic of LBF

The unit of tissue blood flow is generally expressed as [mL/min/100g] in medical field. It means that blood flows, mL, into a unit tissue of 100g in a unit time, min. This unit is based on the measurement of liquid, but LBF does not detect blood flow as the liquid, but as the scattered light from RBCs. Then it is not right to express in the unit for liquid. The exact unit of tissue blood flow measured by LBF is like [N/mm3]×[mm/s]] 1). It means the multiplication of the number density of RBCs in a tissue by the mean velocity. However, this kind of unit is not familiar to medical doctors and they do not know if the measurement value expressed in this unit is rich flow or not. Therefore, our LBFs show the blood flow values being equivalent to the values in [mL/min/100g] 2).
LBF detects the number density of RBC and the velocity, LBF shows different value (FLOW) even if the blood flows in a tissue in a unit time is same. Figure. 7 and 8 have the different vascular structures in the detected volume of tissue by LBF. As an example, the length of the blood vessel in Fig. 8 is B times of that in Fig. 7, and the both of diameter are the same. When the blood flow of “a” [mL/min] flows into the tissue and when it is converted into 100 g, the “tissue blood flow” value as the concept will be expressed as A [mL/min/100g] for the both of tissues. It is because the tissue blood flow unit does not take account of the blood vessel construction in tissue under study. However, the LBF detects the number density and velocity of RBCs. Therefore, when LBF shows the value of “A” for Fig. 7, the value for Fig. 8 will be “A・B” because the number density is B times, and the velocity is the same as that in Fig. 7.
The FLO-Lab shows the frequency characteristic of blood flow in the FFT graph, and it will assist to determine whether the blood flow is of fast velocity or of rich blood volume.

Fig.7. Straight blood vessel

Fig.7. Straight blood vessel

Fig.8. Winding blood vessel Length is B times og Fig.7

Fig.8. Winding blood vessel Length is B times og Fig.7

References :
1) S. Kashima : Study of Measuring the Velocity of Erythrocytes in Tissue by the Dynamic Light Scattering Method, Jpn. J. Appl. Phys., 32, 2177 (1993).
2) S. Kashima : Measurement of Tissue Blood Volume in a Model System and in the Canine Intestine by Dynamic Light Scattering, Laser. Life Sci., 6, 79 (1994).

Computer-based Laser Blood Flowmeter OMEGAFLO-Lab  Summary / Spec | Theory | Price List